Q2 2024 Commentary
KEY TAKEAWAYS
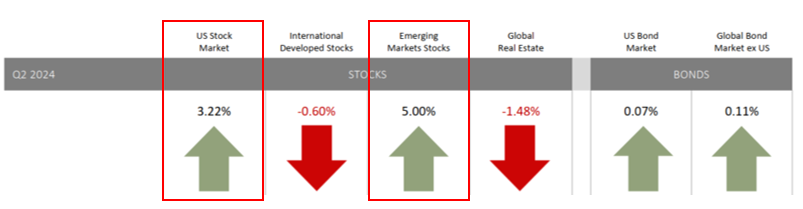
Strong U.S. Equities: U.S. stocks gained +3.22% in Q2 and over +23% in the past year, outperforming most asset classes except emerging markets in the last quarter.
Interest Rate Sensitivity: U.S. REITs outperformed non-U.S. REITs by over 400 basis points in Q2 and tend to perform well when rate hikes end. Fixed income assets watch Fed movements, with an inverted yield curve signaling potential recession, but not guaranteeing it.
Diversification and Long-term Investment: The tech sector led the stock market rally, but relying on a few mega-cap stocks is risky. Broad diversification is essential for long-term investment success.
By Ryan O’Donnell, CFP® and Mike O’Donnell, CFP®
Equities
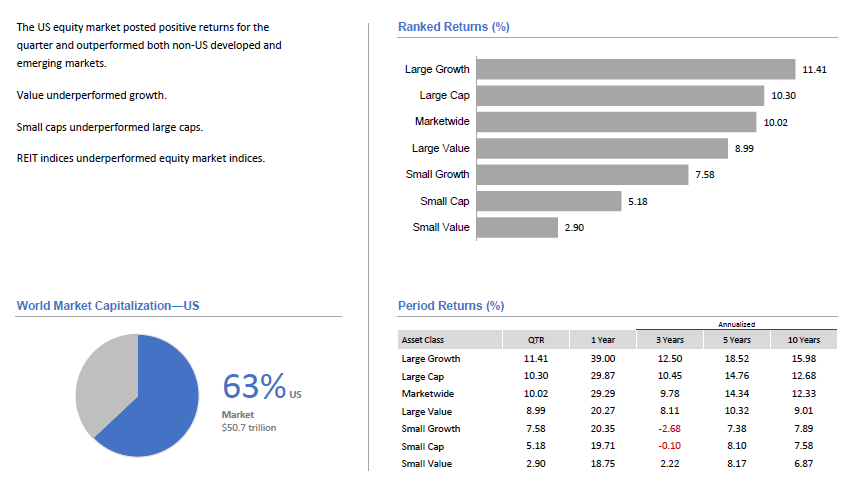
Thanks to slowing inflation and hopes of near-term interest rate cuts, U.S. stocks continued their strong run for the year. U.S. equities gained +3.22 for the quarter ended June 30th. That raised the performance of U.S. stocks to over +23% for the past 12 months, significantly outperforming international developed stocks, global real estate, and most other asset classes during that time period. However, U.S. stocks underperformed emerging market stocks for the quarter ended June 30th (see charts below) as Taiwanese stocks returned nearly 13% thanks to strong investor interest in the AI/chips and Turkish stocks returned over 15% for the quarter thanks to a disciplined new central banking regime.
Index Returns - Q2 2024
A closer look at U.S. equities
U.S. equities once again performed well across the board longer-term. U.S. stocks significantly outperformed non-U.S. stocks, real estate and bonds over 1-year, 5-year and 10-year periods.

Long-term Index Returns
Within the realm of U.S. stocks, value once again underperformed growth in Q2; small caps underperformed large caps; and REIT indices underperformed equity market indices, just as they did in Q1 (see chart below). Large growth and large cap U.S. stocks continued to outperform other sectors of the U.S. stock market over 1-year, 5-year and 10-year periods, handsomely rewarding long-term investors (see chart below). When Fed interest rate cuts finally arrive, that should give a big boost to small-cap and mid-cap U.S. stocks, which tend to be more heavily leveraged than larger-cap stocks.

US Stock Index Returns - Q2 2024
U.S. real estate still outperforming global real estate
While commercial real estate continues to battle record-high vacancy rates in many major metros, U.S. real estate investment trust (REITS) declined only slightly during Q2. In fact, they significantly outperformed non-U.S. REIT’s by over 400 basis points during the quarter (-0.16% to -4.39%) and certainly longer term over 1-year, 5-year and 10-year periods.
As with most real estate investments, REITs are highly interest rate sensitive. When the rate tightening cycle officially ends – which many expect some time in Q3 -- REITs tend to perform well on an absolute and relative basis. After the Fed has reached rate stabilization, REITs historically return 20%+ over that next 12 months.

REITS Index Returns - Q2 2024
Fixed Income
Perhaps no other asset class has been monitoring potential Fed movements more than fixed income. On the short end of the yield curve -- still inverted -- the one-month U.S. Treasury bill yield decreased by two basis points to +5.47%, while the one-year U.S. Treasury bill yield increased 6 basis points to +5.09%. The yield on the two-year treasury note increased 12 basis points to +4.71%.
Many economists and market watchers believe an inverted yield curve signals a forthcoming recession, since a yield curve inversion has preceded all six U.S. recessions since 1976. HOWEVER, an inverted yield curve does not necessarily guarantee that a recession will occur as roughly 30% of the time, recessions have not followed yield curve inversions. In fact, the current yield curve inversion recently hit the two-year mark, the longest yield curve inversion on record.
Rate watchers attribute this statistical anomaly to two things: (1) high consumer savings as the economy exited the Covid-19 pandemic, which provided a buffer against rising borrowing costs and (2) the Fed managed to contain last year's banking turmoil - which was a result of changes in the shape of the yield curve - by offering emergency liquidity measures.

In terms of total returns, short term U.S. Treasury bonds returned +0.77% while intermediate term U.S. Treasury bonds returned +0.58%. Short term corporate bonds returned plus +0.96% and intermediate term corporate bonds returned +0.74%. Meanwhile the total returns for short and intermediate term municipal bonds were +0.35% and +0.92% respectively. Within the municipal fixed income market, general obligation bonds returned -0.30% while revenue bonds returned +0.07%.
Looking ahead
It’s no secret that the stock market rally since October 2023 has been fueled by the technology sector, particularly the “Magnificent Seven” mega-cap stocks (Apple, Microsoft, Google parent Alphabet, Amazon, Nvidia, Meta Platforms and Tesla). However, as Wes Crill, PhD, Senior Investment Director and Vice President, Dimensional Fund Advisors explains at the end of this report, “expecting Mag 7 outperformance to continue is to bet on these companies further exceeding the market's expectations period simply meeting expectations may result in returns more in line with the market, consistent with the history of top US stocks,” Crill added.
“Even the biggest companies have uncertain futures, highlighting the need for broadly diversified investments,” advised Crill last quarter. “And even if these companies stay at the top of the market, that’s no assurance higher returns will continue if their success is expected.”
As always, it pays to be well-diversified and fully invested. You never know which company, asset class, or sector will outperform and which will underperform. As the old saying goes: “Time in the market always produced better outcomes than timing the market.”
While many investors, fearful of a recession, have been holding on to cash since 2022, especially with money market rates returning over 5%. This is not a great strategy, considering that we’re coming up on 12 months since the Fed’s last rate hike. As the chart below shows, cash has historically returned less than 6% in the 12 months following the Fed’s final rate hike (it was July 31, 2023).Not bad, but bonds have historically returned over 11% over a comparable time period and stocks nearly 18%.

We are always available to meet with you or to discuss ideas. Please contact us HERE to schedule a quick meeting with either Mike or Ryan.
Q1 2024 Commentary
Buoyed by relatively strong economic news, low volatility, signs of inflation slowing and expectations of Fed rate cuts on the horizon, U.S. stocks had one of the strongest first quarters in recent memory. U.S. equities gained over 10% in Q1 and posted a +29.29% return for the past 12 months.
By Ryan O’Donnell, CFP® and Mike O’Donnell, CFP®
Equities
Buoyed by relatively strong economic news, low volatility, signs of inflation slowing and expectations of Fed rate cuts on the horizon, U.S. stocks had one of the strongest first quarters in recent memory. U.S. equities gained over 10% in Q1 and posted a +29.29% return for the past 12 months. Notably, the rally spread to other non-tech sectors. U.S. stocks easily outperformed international and emerging stocks, as well as global real estate, U.S. bonds and global bonds for both the quarter and the past 12 months (see chart below). Meanwhile, U.S. bonds lagged most other asset classes as interest rates rose and the Federal Reserve remained on pause regarding planned cuts to interest rates.

Index Returns

Long-Term Market Summary
A closer look at U.S. equities
While U.S. equities performed extremely well across the board, value underperformed growth, small caps underperformed large caps and REIT indices underperformed equity market indices (see chart below).
U.S. REITs still outperforming global REITs
U.S. REITS held steady after an extremely strong Q4 in 2023, generating a Q1 return of -0.39%. While somewhat disappointing, U.S. REITs outperformed non-US REITs by over 200 basis points (-0.39% vs. -2.43%) as well as most other fixed income asset classes in Q1. As with most real estate investments, REITs are highly interest rate sensitive. When the rate tightening cycle officially ends, REITs tend to perform well on an absolute and relative basis. After the Fed has reached rate stabilization, REITs historically return 20%+ over that next 12 months.
Fixed income
Unlike equities, bonds underperformed during Q1 as signs of more persistent inflation and stronger-than-expected economic growth led investors to price in fewer Fed rate cuts than what was expected at the beginning of the year. From where we sit, the big headline for fixed income in Q1 was how U.S. economic data continued to show resiliency and strength despite the highest interest rates in 40 years. This has caused rates to rise after falling sharply in the latter part of last year. For instance, the two-year U.S. treasury yield rose roughly 50 basis points during the quarter.
Expectations for the Fed to cut interest rates peaked at the beginning of the year with many expecting at least half a dozen cuts in 2024. Now, with two Fed meetings and stronger economic growth behind us, the consensus is for two or three cuts at best. If you’re keeping score at home, the last rate hike was nine months ago, (July 2023). Nine months is longer than the historical interval between the last hike to the first cut -- but not unprecedented. Many expect the Fed to change direction at some point between now and the November elections, but when and by how much is anyone’s guess.
As yields rose across the Treasury curve during the first quarter, bond prices fell. The Bloomberg Aggregate Index, a broad measure of the bond market, declined as a result. The bond market dropped slightly in the first quarter, down 78 basis points. With the time horizon for rate cuts being pushed out, it may likely be another year in which fixed income returns are mostly on the back end. Again, you’ll want to stay well-diversified both in terms of duration and asset classes in general.
Inverted yield curve and recession risk

The US. Treasury Yield Curve has been inverted since October 2022 – that’s when yields on short-term instruments exceed yields on long-term instruments. Many economists and market watchers believe an inverted yield curve signals a forthcoming recession, since a yield curve inversion has preceded all six U.S. recessions since 1976. But an inverted yield curve does not necessarily mean a recession is imminent. We are now going on over 18 months since the first inversion of the 10-year/2-year Treasury curve – the longest interval without a recession in over 50 years. That doesn’t guarantee the U.S. economy has achieved a “soft landing,” but the odds of the U.S. economy entering a recession within the next 12 months have now fallen to a two-year low of 33%, according to Bankrate’s latest quarterly economists’ poll. Compare that to 65% back in Q3 of 2022. Meanwhile, a Bloomberg survey of forecasters reduced their consensus recession odds to 40% in 2024, the lowest level since 2022.
As Paul Samuelson famously quipped: “Economists have successfully predicted nine out of the last five recessions.”
We continue to talk with clients about the benefits of earning interest on idle cash that may be sitting in your personal bank account or business. We have an extensive cash management solution to help our clients earn 5%+ on idle cash. Give us a call for more details (530) 564-0960
Looking ahead
It’s no secret that the stock market rally since October 2023 has been fueled by the technology sector, particularly the “Magnificent 7” mega-cap stocks (Apple, Microsoft, Google parent Alphabet, Amazon, Nvidia, Meta Platforms and Tesla). However, as Wes Crill, PhD, Senior Investment Director and Vice President, Dimensional Fund Advisors explains at the end of this report, the “moat” these deep- pocketed companies have built around their businesses can’t last forever.
“Think about the state of mobile phones 15 years ago,” wrote Crill. “In all likelihood, you would have been reading this on a BlackBerry, such was that device’s entrenchment for mobile business communication. Then, along came iPhones and Androids and suddenly BlackBerry’s foothold was eroded.” As Crill recounted, it wasn’t all that long ago that Sears was a Top 10 stock, AOL was synonymous with internet access in the 1990s and 20 years ago, Friendster (not Facebook) was the most popular social media network.
“Even the biggest companies have uncertain futures, highlighting the need for broadly diversified investments,” advised Crill. “And even if these companies stay at the top of the market, that’s no assurance higher returns will continue if their success is expected.”
As always, it pays to be well-diversified. You never know which company, asset class, or sector will outperform and which will underperform. As the old saying goes: “Time in the market always produced better outcomes than timing the market.”
We are always available to meet with you or to discuss ideas. Please contact us HERE to schedule a quick meeting with either Mike or Ryan.
Q4 2023 Commentary
Buoyed by the Santa Claus rally, expectations of Fed rate cuts, and a “soft landing” in 2024, the quarter ended December 31st was the strongest since early 2020. U.S stocks gained over 12% in Q4 to push their return to nearly +26% for the year. U.S. stocks easily outperformed international and emerging stocks (see chart below) for the period.
By Ryan O’Donnell, CFP® and Mike O’Donnell, CFP®
Buoyed by the Santa Claus rally, expectations of Fed rate cuts, and a “soft landing” in 2024, the quarter ended December 31st was the strongest since early 2020. U.S stocks gained over 12% in Q4 to push their return to nearly +26% for the year. U.S. stocks easily outperformed international and emerging stocks (see chart below) for the period.

Meanwhile, U.S. bonds also enjoyed a significant rally in Q4, racking up a +6.8% gain for the three months ended December 31. That performance, which outpaced the global bond market by over 150 basis points, was one of the strongest quarters for U.S. bonds in 40 years, pushing bonds’ full year return for 2023 to nearly +6% (see chart below).

A closer look at U.S. equities
While U.S. equities performed extremely well across the board, value underperformed growth within large caps and outperformed within small caps. Small caps outperformed large caps (see chart below).

REITs on the rebound
Long beleaguered U.S. real estate investment trusts (REITS) turned in an extremely strong Q4, generating a return of 16.4% for the three months ended December 31st. U.S. REITs outperformed non-US REITs by 150 basis points as well as most other equity and fixed income asset classes in Q4. As with most real estate investments, REITs are highly interest rate sensitive. At the end of a rate tightening cycle, REITs tend to perform well on an absolute and relative basis. After the Fed has reached rate stabilization, REITs historically return 20%+ over that next 12 months.
Fixed income
Thanks to the bond rally in Q4, yields generally declined across the yield curve (see below), as expectations of Fed rate cuts in 2024 drove fixed income sentiment. On the short end of the yield curve, the 1-Month US Treasury Bill yield increased 5 basis points (bps) to 5.60%, while the 1-Year US Treasury Bill yield decreased 67 bps to 4.79%. The yield on the 2-Year US Treasury Note decreased 80 bps to 4.23%. At the longer end of the curve, the yield on the 5-Year US Treasury Note decreased 76 bps to 3.84%. The yield on the 10-Year US Treasury Note decreased 71 bps to 3.88%. The yield on the 30-Year US Treasury Bond decreased 70 bps to 4.03%. Despite the possibility of a soft landing in 2024, continued inversion of the yield curve (see below), keeps many economists and market watchers fearful of a recession.

We continue to talk with clients about the benefits of earning interest on idle cash that might be sitting at the bank either in your personal account or in a business you may run. We have an extensive cash management solution to help our clients earn 5%+ on idle cash. Give us a call for more details (530) 564-0960
Recession in 2024?
Rarely does a day go by when someone doesn’t ask me what they should do with their portfolio if and when the long-feared recession actually hits. My response is to cite Paul Samuelson’s famous quip: “Economists have successfully predicted nine out of the last five recessions.”
Nobody knows for sure if and when a recession will hit so it pays to take the long-term view. Stay disciplined and well-diversified because there’s clearly no consensus from the experts. On the plus side, the U.S. economy remains solid heading into 2024. Inflation has cooled, labor markets have remained stable and the Federal Reserve has signaled the possibility of decreasing interest rates at some point in 2024. Many economists, including Federal Open Market Committee, anticipate a soft landing for the U.S. economy in 2024 that will include slowing GDP growth without a recession. However, it’s hard to ignore the two major recessionary risk factors for long: inflation and elevated interest rates. Any hiccup in Fed policy could easily slow the economy to the point that it contracts into a recession. Investors should continue to monitor the labor market in coming months as tight monetary policy often has a lagging impact on economic growth.
While the U.S. economy defied expectations by sidestepping a recession in 2023, Morningstar said the likelihood of a U.S. recession in 2024 is still probably around 30%, compared to 15% in normal years. The New York Fed's recession probability model suggests there is still a 51.8% chance of a U.S. recession sometime in the next 12 months. Bank of America is predicting a soft landing rather than a recession in 2024 and more than three-fourths of economists — 76% — said they believe the chances of a recession in the next 12 months is 50% or less, according to a December survey from the National Association for Business Economics. Again, no clearcut consensus.
Recession not necessarily bad for investors
Whether or not a recession occurs, it shouldn’t cause you to alter your financial plan significantly. Recessions are a natural part of the business cycle as we have to trim the excess in order to set up the next economic expansion. Since 1965, the S&P 500 has generated a median return of +8.5% in the 12 months that followed eight previous yield curve inversions (a longstanding recession indicator), according to data from LPL Research and the St. Louis Federal Reserve Bank. However, an inverted yield curve doesn’t guarantee that a recession will follow.
U.S. deficit
US government debt reached 121% of the value of the country’s gross domestic product (GDP) in 2023. Many investors are concerned that servicing this level of debt could have an adverse impact on the stock market. But as Wes Crill, PhD, Senior Investment Director and Vice President, Dimensional Fund Advisors noted at the conclusion of this report, historical data show little correlation between the national debt and the stock market. “Since 1975, there have been 153 observations of a country exceeding 100% debt/GDP for a year,” said Crill. “Stocks were up for that country/year in 104 of the 153, or about two-thirds of the time.”
As always, it pays to be well-diversified. You never know which company, asset class or sector will outperform and which will underperform. As the old saying goes: “Time in the market always produced better outcomes than timing the market.”
We are always available to meet with you or to discuss ideas. Please contact us HERE to schedule a quick meeting.
Q3 2023 Commentary
The quarter ended September 30th was challenging with U.S. Stocks and Bonds each dropping over 3% across the board. With the Fed still noncommittal about ending its rate hiking cycle and tensions escalating in the Middle East, it’s natural to be concerned.
By Ryan O’Donnell, CFP® and Mike O’Donnell, CFP®
The quarter ended September 30th was challenging with U.S. Stocks and Bonds each dropping over 3% across the board. With the Fed still noncommittal about ending its rate hiking cycle and tensions escalating in the Middle East, it’s natural to be concerned.
As we’ve told many of you during our recent conversations, it’s important to stay the course. Take comfort in the fact that U.S. Stocks are up 13% year-to-date and have gained nearly 20.5% over the past 12 months. In fact, U.S. Stock have been averaging +9.14% annually over the past five years; and nearly +11.3% annually over the past 10 years (see chart below). They’re clearly outperforming other asset classes.

Meanwhile, yields continued to rise thanks to Fed rate increases, with the best rates coming on the short end of the curve. We continue to talk with clients about the benefits of earning interest on idle cash that might be sitting at the bank either in your personal account or in a business that you may run. We have an extensive cash management solution to help our clients earn 5%+ on idle cash. Give us a call for more details (530) 564-0960
Looming recession?
Rarely a day goes by when someone doesn’t ask what they should do with their portfolio if and when the long-feared recession actually hits. Our response is to cite Paul Samuelson’s famous quip: “Economists have successfully predicted nine out of the last five recessions.”
Nobody knows for sure if /when a recession will hit so it pays to take the long-term view. Stay disciplined and well-diversified because there’s clearly no consensus from the experts (see recent comments below):
In the Q3 Conference Board CEO survey, 84% of top execs said they are preparing for a mild recession over the next 12 to 18 months. “The gloom that pervaded among CEOs at the start of 2023 has lessened, but most are still treading carefully,” said Roger W. Ferguson, Jr., Vice Chairman of The Business Council and Trustee of The Conference Board.
Bank of America CEO, Brian Moynihan, recently predicted a 35% to 40% chance of the U.S. economy tipping into a recession by early next year—six to twelve months later than his prediction from earlier this year.
But Goldman Sachs last month lowered its estimated chance of a US recession over the next 12 months to just 15%. The report, titled “Soft Landing Summer,” pointed to a series of encouraging economic indicators on inflation and the jobs market that suggest the US economy will avoid the Federal Reserve-fueled recession that many feared.
However, Vanguard economists wrote in their mid-year outlook that they see a high probability of recession, although “the odds have risen that it could be delayed from 2023 to 2024.”
JPMorgan Chase economists said in a note last week that there could be a “synchronized global downturn sometime in 2024.”
According to economists surveyed by Bankrate, the probability of a recession occurring in the U.S. is significant. The survey, published in July reveals that Bankrate’s experts estimate a 59% chance of a recession taking place by July 2024.
The chart below may have summed it up best:

Recession not necessarily bad for investors
Whether or not a recession occurs, it shouldn’t cause you to alter your financial plan significantly. First, a recession is a natural part of the market cycle. We must trim the excess in order to set up the next economic expansion, right? In fact, since 1965, the S&P 500 has generated a median return of +8.5% in the 12 months that followed eight previous yield curve inversions, according to data from LPL Research and the St. Louis Federal Reserve Bank. If you recall from earlier posts, an inverted yield curve – when short term rates pay investors more than long-term rates – has occurred before every single recession since the Great Depression. However, an inverted yield curve doesn’t guarantee that a recession will follow. But if it does, a recent Wall Street Journal Report reminds us that it could be time for small-cap stocks to outperform their large-cap brethren. Did you know that over the past 11 recessions, a small-cap stock index maintained by MSCI has beaten large-caps in the 12 months after a recession was declared every time, leading them by 16.51 percentage points on average?
As always, it pays to be well-diversified. You never know which stock, asset class or sector will outperform and which will underperform. As Wes Crill, PhD, Senior Investment Director and Vice President, Dimensional Fund Advisors noted at the conclusion of the attached report, the first half of 2023 marked only the 10th time in the last century that value stocks have underperformed growth stocks by more than 20 percentage points over a two-quarter period. “More often than not, value has responded like the hero in an action movie, beating growth over the following four quarters in seven of the nine previous instances and averaging a cumulative outperformance of nearly 29 percentage points,” asserted Crill. “A positive average value premium following a large negative period is not too surprising. “
Regardless of value’s recent performance, investors should expect positive value premiums going forward. “That’s a strong incentive for investors to maintain a disciplined stance to asset allocation, so they can capture the outperformance when value stocks deliver,” Crill added.
Enjoy the beautiful autumn season. As always, we are available to meet or discuss ideas. Please contact us HERE to schedule a quick meeting with either Mike or Ryan.
Q2 2023 Commentary
Even though people have been nervous about the markets and a looming recession all year, the markets have a way of surprising us. US stocks gained 8.4% in Q2 as per the S&P 500 and were up nearly 17% for the first six months of 2023. Meanwhile, the tech-heavy NASDAQ is up over 29% year to date. Not many saw that coming!
By Ryan O’Donnell, CFP® and Mike O’Donnell, CFP®
Even though people have been nervous about the markets and a looming recession all year, the markets have a way of surprising us. US stocks gained 8.4% in Q2 as per the S&P 500 and were up nearly 17% for the first six months of 2023. Meanwhile, the tech-heavy NASDAQ is up over 29% year to date. Not many saw that coming!
Naysayers argue this market rally has been driven by a handful of mega-cap tech stocks with the rest of the companies not doing much. Further they point to tepid corporate earnings overall and the fact that small cap growth (and value) stocks are lagging, commercial real estate is reeling and taking many REITs down with it. Oh, and the yield curve remains significantly inverted and is likely to remain so until the Fed finishes its most aggressive rate hiking cycle in 40 years.
“The stock market has predicted nine out of the last five recessions.” -- Paul Samuelson
You may have heard that an inverted yield curve (when short term rates are higher than long term rates) has preceded every recession since the 1920s. Yes, it’s true. But what many cynics overlook – including the talking heads on TV--is that a recession doesn’t ALWAYS happen after the yield curve inverts. An inverted yield curve is simply a signal that the majority of investors expect a recession near-term. Their fears don’t always pan out. For instance, the yield curve inverted in 1998 and 2019, but no recession followed until much later. There was also a false positive in the mid-1960s. Meanwhile the current yield curve has been inverted since March 2022—sixteen months ago—and so far, no recession has occurred. In fact, only two-thirds of the time that the yield curve has inverted has the U.S. economy fallen into a recession within 18 months.
Recession not necessarily bad for investors
Many argue that a recession is a natural part of the business cycle. We have to trim the excess in order to set up the next economic expansion, right? In fact, since 1965, the S&P 500 has experienced a median return of +8.5% in the 12 months that followed eight yield curve inversions, according to data from LPL Research and the St. Louis Federal Reserve Bank.
So, if you had listened to all the pundits and fled to cash – especially with rates on CDs and money markets at two-decade highs -- you would have missed out on one of the strongest stock market rallies in recent memory. Of course, our clients already know this.
Sure, a recession is still possible, even though the jobless rate remains near a 50-year low, consumer spending remains strong and inflation is down to its historical average of 3% on an annualized basis. The Fed will likely continue raising interest rates, albeit more modestly, which makes borrowing more expensive for consumers and businesses. Inflation could spike again, especially in the volatile food and energy sectors and more banks could fail, which would exacerbate the already tightening credit conditions. But so far, no crisis.
Given that backdrop, it’s nearly impossible to predict which sectors, countries and asset classes will do well at any given time and which will lag. Remember how well energy was doing last year and how poor tech was doing? What a difference a year makes. The point is that portfolios with larger well-diversified allocations to stocks are considered riskier, but they have higher expected returns over almost every time period. Study after study shows you are unlikely to achieve your financial goals without having some level of risk in your portfolio. With that risk, you’ll have volatility from time to time. But sticking to your plan and not panicking will get you through occasional bumps in the road.
It’s almost impossible to know when to get out (or pare down) and when to get back in. Meanwhile, time you spend on the sidelines can be very damaging to your portfolio since you can’t harness the power of compounding when the market rallies unexpectedly as it has so far this year.
Another indicator that’s encouraging us is that market volatility has eased tremendously this year. It seems more and more uncertainty has been removed from investors’ calculus. As this great chart from Morningstar shows below, we’ve had only two days this calendar year in which stocks moved up or down more than 2%. Compare that to 2022 and 2020 when we had more than 40 trading days in the year in which stocks moved up or down more than 2%. Since 2001, stocks have gained on average 17.2% in years with 10 or fewer trading days of +/- 2%. Compare than to returns of only 0.3% on average when we have more than 10 trading days of +/- 2%.

Further, stocks tend to continue rallying after a strong first half of the year

As a thoughtful financial advisor once observed, “A portfolio is like a bar of soap. The more you handle it, the less you have.”
Major Headlines for Q3
“US Inflation Eased to 5% in March; Lowest Level in Nearly Two Years”
“US Signals Support for Allies to Send Their F-16 Jets to Ukraine”
“S&P 500 Starts a New Bull Market as Big Tech Lifts Stocks”
Nasdaq Posts Best First Half since 1983”
“Fed Holds Rates Steady but Expects More Increases”
Enjoy your summer. As always, I am available to meet or discuss ideas.
PS: Congrats to all the parents of recent college grads. If you’re a US investor and lucky enough to have up to $35,000 left over in your 529 college savings plan, you can roll it over into a Roth IRA starting in 2024, provided the account has been open at least 15 years.
Q1 2023 Commentary
Despite the scary headlines about bank failures, a looming recession, China tensions, natural disasters and stubbornly high inflation and interest rates, it was a great quarter for stocks. U.S. equities were up over 7% for the quarter ended March 31st and international stocks were up over 8%. We also saw an increase in bond prices during Q1, which we haven't seen in quite some time. In fact, U.S. bonds rose in value (not just yield) by almost 3% during the most recent quarter.
By Ryan O’Donnell, CFP® and Mike O’Donnell, CFP®
“When you come out of the storm, you won’t be the same person who walked in. That’s what this storm’s all about.” ― Haruki Murakami, Kafka on the Shore
Despite the scary headlines about bank failures, a looming recession, China tensions, natural disasters and stubbornly high inflation and interest rates, it was a great quarter for stocks. U.S. equities were up over 7% for the quarter ended March 31st and international stocks were up over 8%. We also saw an increase in bond prices during Q1, which we haven't seen in quite some time. In fact, U.S. bonds rose in value (not just yield) by almost 3% during the most recent quarter.
Despite those positive trends, three regional U.S. banks failed, including Silicon Valley Bank, which was the second largest bank failure in our nation’s history. And then European giant, Credit Suisse was on the verge of going under, before agreeing to be bought out by rival UBS. With instability in our banking system top of mind for the first time since the global financial crisis, many of you have been wondering how safe your deposits are at your bank. Most experts believe these banking failures were isolated incidents driven by gross mismanagement of duration risk and having too high a concentration of depositors from the same industry. They don’t think the failures will cause a contagion like we saw in 2008-2009.
Rest assured, the U.S. government insures up to $250,000 in deposits per account holder in checking, savings, and money market accounts through the FDIC. Not one of our client’s has any uninsured cash deposits with our firm. We keep excess cash invested in either money market funds or US treasuries. If you do have more than $250,000 sitting in cash at your bank, you may want to think about redeploying those funds into higher yielding, but still very safe, U.S. Treasuries. One silver lining to the Fed’s rate hiking campaign is that we’re seeing attractive yields in fixed income for the first time in 18 years. For instance, U.S. Treasury Based money market funds are yielding almost 4.5% right now with daily liquidity, and three U.S.-backed bonds are yielding around 4.7%, which is a great alternative to what banks are paying. In fact, we've been working with a lot of companies on their cash management strategies to help them better manage risk and increase their yield on short-term securities.
With higher yield on short-term fixed income and uncertainty about the stock market, interest rates and the economy, there’s clearly a lot of “dry powder” on the sidelines waiting to be deployed. That tends to be a good set up for stocks. In January, money market assets hit a historic peak. When that much cash builds up, as the chart below shows, it tends to be a precursor to double-digit stock market returns over the next three years.

That doesn't mean there wasn't some serious turmoil in the last quarter that continues weighing on peoples’ minds. In addition to the aforementioned bank failures…
The odds of a U.S. recession in 2023 hit 65% according to Bloomberg’s latest monthly survey.
The U.S. shot down a Chinese spy balloon off the coast of South Carolina.
The dollar continues to depreciate, helping to boost returns of our international holdings.
Artificial intelligence is disrupting industries and careers at an unprecedented level.
As we remind our clients during times like these: Uncertainty is unavoidable; market timing is futile; and diversification is still an incredibly powerful tool for reducing the many risks you face as an investor.
When the headlines worry you, bank on sound investment principles
Rather than rummaging through your portfolio looking for trouble when headlines make you anxious, turn instead to your investment plan. Rest assured your plan is designed with your long-term goals in mind and is based on principles that you can stick with, given your personal risk tolerances. While every investor’s plan is a bit different, ignoring headlines and adhering to time-tested principles may help you avoid making shortsighted missteps. The last thing you want to do is allow the news media or your close friends to convince you to stray from your plan. You never want to try getting in (or out) of the market at just the right time to avoid short-term pain. Study after study shows that timing strategies almost never work. Mis-timing your bets by even a few days can cause irreparable loss of capital over the long term.
Data from Morningstar and Ned Davis Research shows that 78% of the stock market’s best days occur during a bear market or during the first two months of a bull market. If you missed the market’s 10 best days over the past 30 years, your returns would have been cut in half. And missing the best 30 single days would have reduced your returns by an astonishing 83%! And last time I checked; the market is not going to text with instructions to get back in, because it’s planning to have a big day.

Conclusion
As OG clients know, a well-constructed financial plan assumes market corrections and outsize volatility will occur from time to time. Sticking to your plan will position you well to handle any threats that come our way. Despite a severe correction in equity markets in 2022, and a daily barrage of alarming headlines in early 2023, U.S. stocks are still generating average annual return of 10.45% over the past five years and 11.73% annually over the past 10 years – far outpacing any other asset class.
As Nobel laureate Merton Miller used to say, “Diversification is your buddy.”
We hope you’re staying safe and healthy. Again. If you have a question or just want to review your performance, please contact us HERE to schedule a quick meeting with either Mike or Ryan.
Q4 2022 Commentary
As we start a new year, our team wanted to take a moment to reflect on the past quarter and 12 months to express our gratitude for your continued trust in our services. While 2022 was a challenging year for many, we’re pleased to report that our investments substantially outperformed our benchmarks, and we expect more of the same in the coming years.
By Ryan O’Donnell, CFP® and Mike O’Donnell, CFP®
As we start a new year, our team wanted to take a moment to reflect on the past 12 months and to express our gratitude for your continued trust in our services. While 2022 was a challenging year for many, we’re pleased to report that our investments substantially outperformed our benchmarks, and we expect more of the same in the coming years.
Uncertainty about interest rates, inflation, and the economy throughout 2022, threw many strong headwinds at investors. Despite these challenges, which caused significant volatility in the first part of 2022, the year ended with a solid 4th quarter for stocks (up over 7% in the U.S. and even higher in international markets). The pressure we continue to see in the bond market, however, is driven by continued interest rate hikes by the Federal Reserve.
Looking at the fixed income side, we see that in December of 2021, the 3-month Treasury Bill was paying essentially 0% and the 10 Year Treasury Note was paying about 1.25%. Fast forward one year and the 3 Month Treasury is paying almost 4.50% (a 400% increase!) and the 10 Year Treasury is around 3.6% (also a huge increase). That’s not a misprint. The longer-term Treasury is paying less than the shorter-term T-Bill in a fairly rare occurrence called a “yield curve inversion.”

You will see a drop in value on your investor statement under Treasurys, but it's really an opportunity to earn higher interest. That’s because you can now earn between 4% and 5% interest on your cash risk free.
While inverted yield curves have a reputation for foreshadowing recessions, a recession doesn’t always follow a yield curve inversion as was the case in 2020. You might also be surprised to know that the market actually does well between the onset of an inverted yield curve and the market top that precedes any recession-induced drawdown in equites. The last four times the yield curve inverted, the S&P 500 was up an average of 28.8% before it peaked and it took on average 17 months to reach its peak. So, it’s certainly not time for investors to bail on stocks (see chart below):

The economy is not the market and vice-versa
It's important for us as investors to differentiate between the economy and the stock market. While it's easy to use the two interchangeably, remember the U.S. economy reflects what's happening today in terms of goods and services we buy and sell. The stock market forecasts the future profits and cash flow of publicly traded companies. Many of the stiff economic headwinds the news media tells us about every day -- layoffs, inflation, reduced consumer spending -- have already been priced into the market.
You’ve all seen the headlines screaming: “Stocks Close Out Worst Year since 2008.” It’s true. Stocks in the U.S. and abroad had their worst year since the global financial crisis (see top row of chart below). But even with those double-digit losses included, stocks, particularly U.S. stocks (as measured by the S&P 500) have delivered very strong positive returns to investors over the past five years (+8.79% annually) and past ten years (12.13% annually) See second and third row of the chart below. As always, “time in the market always beats trying to time the market.” I can’t think of a better time to stress the importance of sticking to you plan and keeping the long view in mind.”

As David Booth, legendary founder of Dimensional Fund Advisors wrote at the end of this report: “The purpose of having an investment plan is so you can relax. So, you don’t look at the market every day, stressing out and asking, “How’m I doing? How’m I doing?” Investors actively trading are not just potentially missing out on the expected return of the market—they’re stressed out, worrying about how the news alert they just received will impact their long-term financial health, and whether they can or should do anything about it.”
Conclusion
As OG clients know, a well-constructed financial plan assumes market corrections and outsize volatility will occur from time to time and is well positioned to handle those threats. We hope you’re staying safe and healthy. Again, if you have a question or just want to review your performance, please contact us HERE to schedule a quick meeting with either Mike or Ryan.
Q3 2022 Commentary
October has a reputation for being the worst month of the year for investors. Some of the biggest market crashes have hit in October -- The Bank Panic of October 1907, Black Tuesday (October 1929), Black Monday (October 1987), and the darkest days of the global financial crisis (October 2008) when Lehman Brothers went under and AIG almost did. But research shows October is not the worst performing month of the year (September has that honor); it’s simply the most volatile month. As I’ll explain in a minute, volatility is not necessarily bad. But uncertainty is what’s driving the markets right now whether it’s concern over inflation, the war in Ukraine or how far will the Fed go with rate hikes.
By Ryan O’Donnell, CFP® and Mike O’Donnell, CFP®
October has a reputation for being the worst month of the year for investors. Some of the biggest market crashes have hit in October -- The Bank Panic of October 1907, Black Tuesday (October 1929), Black Monday (October 1987), and the darkest days of the global financial crisis (October 2008) when Lehman Brothers went under and AIG almost did. But research shows October is not the worst performing month of the year (September has that honor); it’s simply the most volatile month. As we’ll explain in a minute, volatility is not necessarily bad. But uncertainty is what’s driving the markets right now whether it’s concern over inflation, the war in Ukraine or how far will the Fed go with rate hikes.
Silver lining to the high rate/high inflation storm clouds
How bad is inflation really? In talking with many of you, there seems to be two camps:
1) Those who think inflation is still a huge problem and the Fed is doing the right thing, and
2) Those who think the Fed is overdoing it and will be forced to reduce rates drastically in the future.
No one knows for sure. But rising rates aren’t all doom and gloom. For instance, 6-month Treasurys are yielding over 4%. While this sharp increase in rates is painful for those who own fixed income, the pain will be made up in very short time by the increase in yields. Retirees, near-retirees, and others with lower risk tolerance are finally getting some relief. The strong U.S. dollar (another unintended consequence of the Fed’s aggressive policies) makes now an excellent time to travel abroad or to purchase imported cars or luxury goods you’ve had your eye on. And the current bear market has created an opportune time to harvest losses and rebalance your portfolio – something we do all year-round for our clients.
That being said, the Fed is almost certain to raise interest rates at its next meeting after this week’s (Oct. 13) Core Inflation numbers revealed that inflation remains stubbornly high. But sharp volatility doesn’t necessarily mean losses for investors. Regardless, our clients know that occasional market corrections and high volatility are already baked into their long-term financial plans.
But the near-term could be a bumpy ride. According to research from LPL Financial, there have been more 1% or larger daily swings in the S&P 500 during October than in any other month of the year. Over the last 30-plus years, the Chicago Board Options Exchange's CBOE Volatility Index (aka The VIX or the “Fear Gauge”), has been higher/more volatile in October than any other month (see chart below). And that’s in a normal year.

The peaks and troughs in 2022 and early 2023 could be more pronounced than usual, but don’t let anyone tell you: “this time it’s different.” As always, a well-diversified long-term plan always wins out in the long run. As the old saying goes: “Time in the market always beats trying to time the market.”
For instance, even with a nearly 18% drop in value over the past 12 months (through Sep. 30), U.S. stocks are still generating hefty, annualized returns of 8.62% a year over the past five years and 11.39% a year over the past 10 years, far surpassing global real estate and international stocks.

Major Headlines for Q3
“Fed Raises Interest Rates by 0.75 of a Percentage Point for Third Straight Meeting.”
“Biden Signs Bill Aimed at Lowering Drug Costs, Boosting Renewable Energy.”
“US Home Sales Dropped in July for Sixth Straight Month.”
“Mortgage Rates Top 6% for the First Time since the 2008 Financial Crisis.”
“ECB Raises Interest Rates by Historic 0.75 of a Point as Europe Stares at Recession.”
“Queen Elizabeth II Dies” and “Liz Truss Is Appointed UK Prime Minister.”
“Freight Railroads, Unions Reach Deal to Avert Strike.”
Conclusion
Again, a well-constructed financial plan assumes market corrections and outsize volatility will occur from time to time. We hope you’re staying safe and healthy. Again. If you have a question or just want to review your performance, please contact us HERE to schedule a quick meeting with either Mike or Ryan.
Q2 2022 Commentary
We’re not going to sugarcoat it. The 2nd quarter (ended June 30th) was pretty negative in terms of returns for stocks, bonds and most other asset classes. You have to go back to 1970 (-21%) to find a time when the markets had a six-month decline as steep as we just endured. And you have to go back to 1969 to find a time when both stocks and bonds were in negative territory during the same year. Just remember, three months is a very short time in the investment world and the market has a short memory.
By Ryan O’Donnell, CFP® and Mike O’Donnell, CFP®
It’s summertime. Many of us are traveling or busy with kids and family plans. But we’d love to catch up with you, hear what you’re up to and talk about anything that might be on your mind.
We’re not going to sugarcoat it. The 2nd quarter (ended June 30th) was pretty negative in terms of returns for stocks, bonds and most other asset classes. You have to go back to 1970 (-21%) to find a time when the markets had a six-month decline as steep as we just endured. And you have to go back to 1969 to find a time when both stocks and bonds were in negative territory during the same year. Just remember, three months is a very short time in the investment world and the market has a short memory.
Case in point: Despite a terrible first half in 1970, the markets bounced back with a gangbuster 2nd half (+27%). We’re not saying 2022 will be the same as the 1970s; We’re saying that markets are unpredictable in the short term. It’s easy to look back and say: “Well, of course inflation was coming, or of course the stock market was too high.” But people have been saying that for years.
It’s the “unexpected” things – the outliers -- that rattle the markets. Few expected that Russia would go through with its threatened invasion and occupation of Ukraine. Few saw the Fed raising rates three times faster than anticipated. These are the unexpected things that jolt investor confidence and move markets. If you rewind the tape to the three most turbulent markets we’ve had recently, you’ll see they were ignited by extreme outlier events: A COVID lockdown in 2020; a global financial crisis in 2008 that almost brought down the entire banking system; and a terrorist attack on the Twin Towers and Pentagon in 2001. Did anyone honestly predict those tragedies? Nope.
We’re not saying there isn’t more bad news ahead, but we can also benefit from positive surprises. What if China decides to side with the United States and removes Vladimir Putin from Russia? That could end the war and create a highly beneficial alliance between us, China and Europe. Suppose a new drug is developed that cures cancer, or a new technology emerges that eliminates the need for fossil fuels and makes energy and effectively free? If any of those things take place, there would likely be a giant boom for the stock market. Will they happen? We don’t know. But when you’re in the predicting game your often wrong.
As baseball great Yogi Berra liked to say: “It's tough to make predictions, especially about the future.”
So how did the markets end up in Q2? U.S. stocks, as measured by the S&P 500 were down 16.7% for the quarter while the U.S. bond index was down 4.69%. Again, only twice since the Great Depression have U.S. stocks and bonds finished the year in negative territory at the same time. It hasn’t happened since 1970 and we don’t see it happening again in 2022. In fact, the average return for the market following a 20% (bear market) decline since the Great Depression has been +22% after one year + 41% after three years and +72% after five years. More on that in a minute.
Major headlines for Q2:
Mortgage rates hit 5% for the first time since 2011.
U.S. inflation hit a four-decade high.
The Fed raised interest rates 0.50% -- its largest rate hike since 2000.
The Fed raised interest rates AGAIN. The 0.75% hike was the largest single rate move since 1994.
The markets posted their worst first half in four decades (see above).
We suspect many of you were caught off guard by the weak performance of bonds during the first half. Conventional wisdom is that bonds are a safe haven for your money during times of stock market volatility. While the depressed valuations of bonds may be disturbing, it’s important to remember that bonds are not stocks. Bond values change based on two separate factors -- credit and interest rates. The credit has not changed. Companies we loan money to are not nearing default. The real change has to do with interest rates, which means it’s an opportunity cost: Am I better to take a loss today to get more interest, or am I better off holding my investment and earning less interest? Either way you will come out ahead.
If you review the Fed’s last five major rate hikes, short-term bond prices decreased each time, averaging 4.5%. Investing in bonds is still about minimizing the volatility of equities and providing yield. That hasn’t changed.
Recession
It’s hard to discuss the near-term future of the economy and financial markets without mentioning the dreaded R-word. But, as our colleague Marlena Lee, Ph.D. explains, a recession is not necessarily a reason to sell. In fact, it may be a good time to buy. Are we headed into a recession? “A century of economic cycles teaches us we may well be in one before economists make that call,” wrote Lee. “One of the best predictors of the economy is the stock market itself. Markets tend to fall in advance of recessions and start climbing earlier than the economy does.”
As the old saying goes: “Economists have predicted 9 out of the last 5 recessions.”
Market returns are often positive during a recession. If nothing else, history teaches us that you want to remain invested at times like these and not try to get in and out of the market. “When stocks have declined, it might be tempting to sell to stem further losses” noted Lee. “You might think, ‘I’ll sit out until things get a bit better.’ But by the time markets are less volatile, you’ll have often missed part of the recovery. Yes, it stings to watch your portfolio shrink, but imagine how you’ll feel when it’s stuck while the market rebounds,” Lee added.
Finally, now may be a good time to reassess your portfolio and your plan. Beyond having a well-designed portfolio, one of the best ways to deal with volatile markets and disappointing returns is to have planned for them. A financial advisor can help you develop a plan that bakes in the chances you’ll experience some market lows. And they can help you find the confidence to weather the current storm and get to the other side.
Conclusion
We hope you’re staying safe and healthy. Again. If you have a question or just want to review your performance, please contact us HERE to schedule a quick meeting with either Mike or Ryan.
Q1 2022 Commentary
What happened in the U.S. and abroad?
With the highest inflation in 40 years, on top of Russia’s invasion of Ukraine, the Fed raising interest rates for the first time since 2018 and a new COVID variant emerging, there were plenty of headwinds for the economy and financial markets in Q1.
By Ryan and Mike O’Donnell
What happened in the U.S. and abroad?
With the highest inflation in 40 years, on top of Russia’s invasion of Ukraine, the Fed raising interest rates for the first time since 2018 and a new COVID variant emerging, there were plenty of headwinds for the economy and financial markets in Q1. I’m not going to sugarcoat it:
US stocks: -5.28%
International Stocks: -4.81%
Emerging Markets: -6.96%
Bonds: -5.93%
But as Abraham Lincoln liked to say: “This too shall pass”
Beneath all these exogenous factors, company earnings remain strong, the economy is still growing, jobs are plentiful, and interest rates are still near their historical lows. When you start looking at longer term periods since 1928, stocks have never had a negative return over any rolling period longer than 10 years. Most other asset classes follow a similar pattern.
Bond market
One thing that stands out for me amid all the red on the screen is the sharp decline in the bond market. Conventional wisdom is that bonds are the safe part of your portfolio, but the Bloomberg Aggregate Bond Index was down 5.93% last quarter – its worst three-month run since 1980. It's important to know why. The price and value of a bond is directly tied to current interest rates. As rates rise, the price of a bond falls. When the bond matures (or the money is reinvested) it's reinvested at a higher rate. And as I’ll touch on in a minute, that’s not necessarily a bad thing, especially for savers and retirees as they can garner some badly needed yield with the right strategy. While no one knows for sure where interest rates are headed, the Fed has signaled up to seven or eight rate increases are likely in the next 12 to 18 months. Don’t bet on lower rates for the foreseeable future.
Investing in fixed income is fluid, meaning bonds are maturing and being reinvested. So, it's a hard asset class to view at a static point in time. Just know The Fed has raised rates aggressively a number of times over the past 30 years, most memorably in 1994-1995 when it raised rates by a full 3%. It also raised rates by a total of 1.75% in 1999-2000, by 4.25% from 2004 to 2007, and by a total of 2.25% between 2015 and 2019. In every single one of those rate raising periods, the various bond indices returned +4% on an annualized basis.
Major headlines from the past 3 months?
“Interest-Rate Worries Batter Stock Market; Nasdaq Sinks More than 3%”
“S&P 500 Falls into Correction Territory as Russian Troops Enter Ukraine Region”
“US Inflation Reached 7.9% in February; Consumer Prices Are Highest in 40 Years”
“Fed Raises Interest Rates for First Time since 2018”
“Gas Prices Shoot Up at Fastest Rate on Record”
Diversification
Portfolios with larger allocations to stocks are considered riskier, but they have higher expected returns over almost every time period. Study after study shows you are unlikely to achieve your financial goals without having some level of risk in your portfolio. With that risk, you’ll have volatility from time to time. But sticking to your plan will get you through the bumps in the road.
Is it time to sell stocks?
Is inflation bad for stocks. Do the losses in popular tech stocks signal a downturn ahead for the broad market? Should I be doing something different in my portfolio? This is just another version of the market timing question? It’s almost impossible to know when to get out (or pare down) and when to get back in. Meanwhile, the time you spend on the sidelines can be very damaging to your portfolio.
As a thoughtful financial advisor once observed, “A portfolio is like a bar of soap. The more you handle it, the less you have.”
1st Quarter 2020 - Market Review
Above is a review of the first quarter 2020. As you are all likely aware the returns were not exactly great. At a high level US stocks fell 21% for the quarter while international and emerging market stocks fell 23% respectively. Returns were actually positive for the quarter and it was looking as if it was going be a great quarter until February 18th when stocks dropped 30% from then through March 31st.
A bright spot as I write this the markets are up 13% this month.